Every fall, provosts and boards ask some version of the same question: how many of last year's new students came back? The number that answers it carries more weight than almost any other metric on campus, because it predicts graduation outcomes, drives tuition revenue, and shows up in rankings and accreditation reviews. A student retention rate is the percentage of first-time, full-time students who return to the same institution the following fall, calculated by dividing the number of returning students by the size of the original cohort and multiplying by 100.
Simple formula, complicated reality. This guide covers the standard definition, the calculation and its edge cases, how retention differs from the metrics it gets confused with, and what a realistic benchmark looks like for your institution.
The standard definition, and why everyone uses it
The retention rate most institutions report follows the federal IPEDS definition: the share of the fall cohort of first-time, full-time degree-seeking undergraduates who are enrolled again at the same institution the following fall. That fall-to-fall, same-institution framing matters because it is what makes numbers comparable across schools. When the National Center for Education Statistics publishes retention figures, this is the definition underneath them.
It is also worth knowing what the standard definition leaves out. Part-time students, transfer students, and spring admits are not in the classic first-time full-time cohort, so an institution serving mostly adult or transfer populations can look worse on paper than it performs in practice. Many institutions now track supplemental retention rates for those groups internally, which is a good habit even though the federal headline number stays cohort-based.
How to calculate it, step by step
Take your fall cohort of first-time, full-time degree-seeking undergraduates. Count how many of them are enrolled at your institution on the census date the following fall. Divide, then multiply by 100. If 850 of a 1,000-student cohort return, your retention rate is 85%.
The edge cases are where calculations drift. At two-year institutions, IPEDS counts students who completed their program by the following fall as retained; at four-year institutions, only re-enrollment counts. Institutions may exclude students who left for reasons like military deployment, death, or church mission service. Students who transfer out and thrive elsewhere still count against same-institution retention, which is worth remembering when you interpret the number: retention measures your institution's ability to keep students, which is related to but distinct from those students' overall success.
Consistency is the real discipline here. Pick your census dates and exclusion rules once, document them, and hold them steady year over year so your trend line means something.
Retention vs. persistence vs. graduation rate
These three metrics travel together and get conflated constantly. Retention is institution-centered: did the student return to you? Persistence follows the student instead, asking whether they continued in higher education anywhere, including at a different school. The National Student Clearinghouse Research Center tracks both nationally, and the gap between them is roughly the share of students who transfer rather than stop out. If the retention and persistence distinction is the one you keep re-explaining, we cover persistence rate vs. retention rate in more depth.
Graduation rate is the long-horizon cousin, typically measured at 150% of program length, so six years for a bachelor's degree. First-year retention is one of the strongest early predictors of it. A student who returns for the second fall is dramatically more likely to finish, which is why so much retention effort concentrates on the first year even though attrition continues after it. Our look at time to degree and what a fifth or sixth year costs puts numbers on how many students finish after the four-year mark.
What counts as a good retention rate
The honest answer is that "good" depends on sector, selectivity, and the students you serve. NCES data puts the average full-time retention rate at four-year institutions at about 82%, with highly selective institutions frequently above 90% and open-admission institutions around 60 percent or below. Two-year institutions typically land lower on the same-institution measure, partly because successful transfer out is baked into their mission.
That spread is why the most useful benchmark is rarely the national average. Compare against your own trend line first and a peer group second: institutions with similar admissions profiles, program mixes, and student demographics. A rural open-access college moving from 62% to 66% has done something harder, and arguably more meaningful, than a selective university holding steady at 91%.
Moving the number: visibility before intervention
Improving retention starts with seeing risk earlier. Most students who leave show signals well before they go: a slipping GPA, a schedule that drifts off their degree path, missed registration windows, credits that stop accumulating toward requirements. When that information sits in disconnected systems, advisors find out at the end of the term, after the decision to leave has hardened.
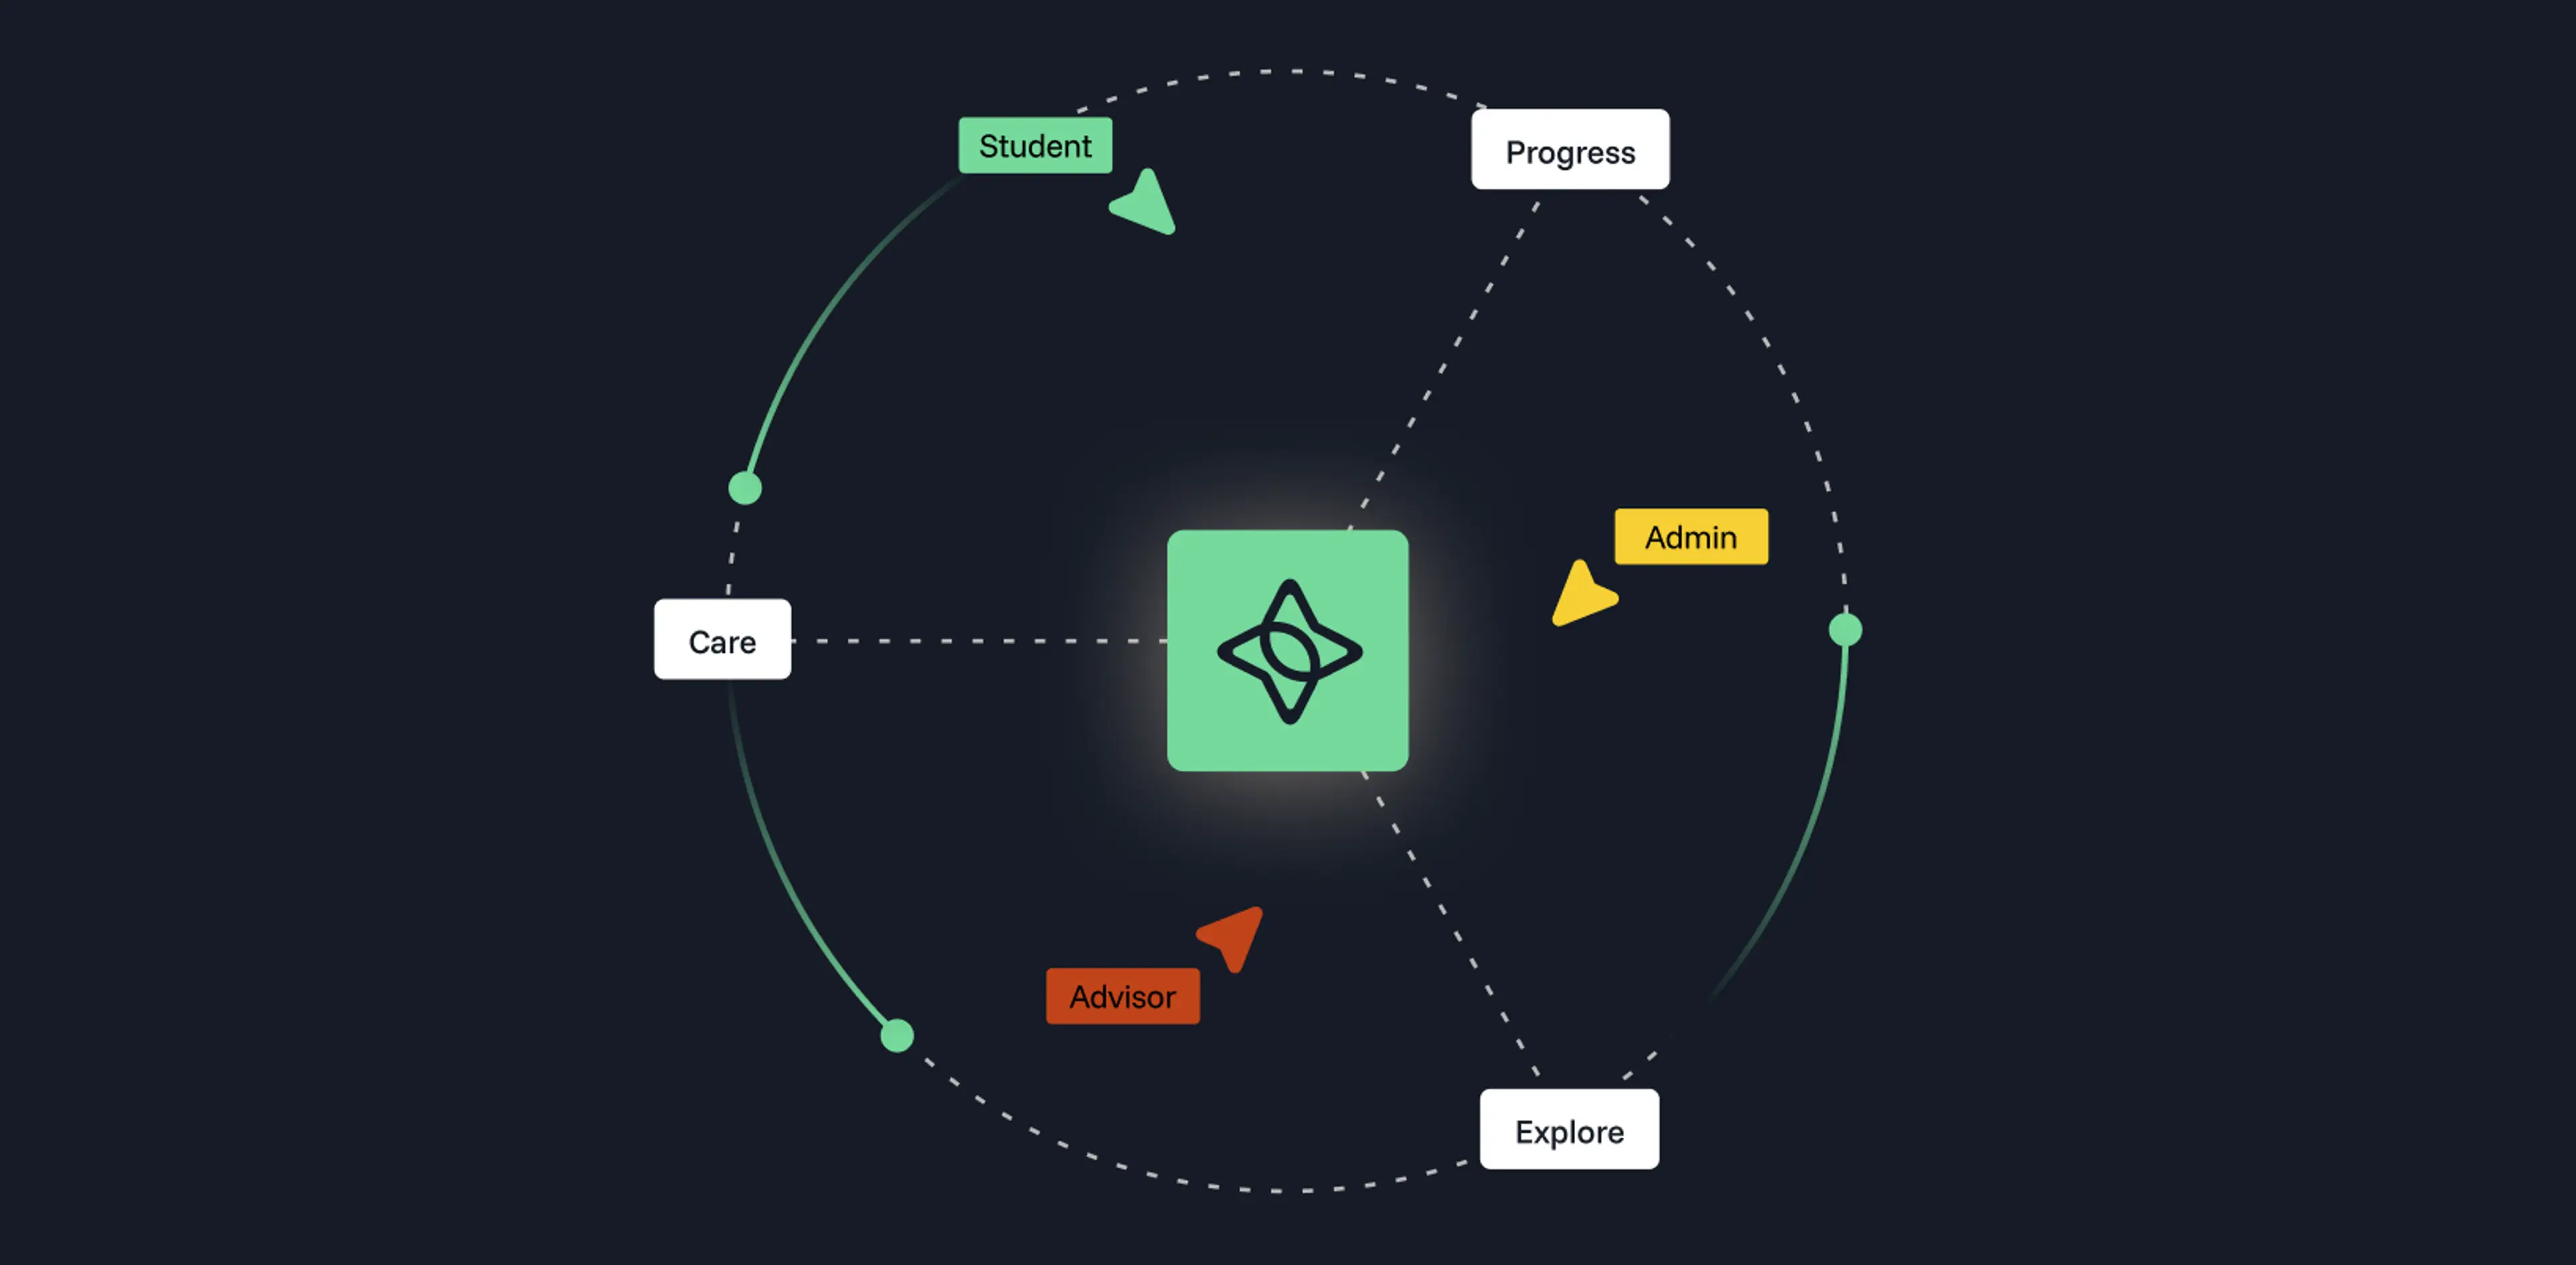
Institutions that improve retention give advisors and registrars a live view of degree progress, then act on it, reaching out when a student's plan goes off track rather than after they fail to re-enroll. That is the thinking behind Stellic's Care, and it pairs with the practical tactics in our guide to student retention strategies.
A number worth improving for the right reasons
Behind every point of retention is a group of real students who either found their footing or quietly slipped away. Treating the rate as a diagnostic, a prompt to ask which students are leaving, when, and why, is how the number starts to move. The institutions that improve retention durably answer those questions with specifics.
If you want to see how institutions use degree progress data to spot at-risk students while there is still time to act, we would be glad to walk you through it. Request a demo any time.
Retention gaps often concentrate among specific populations, including first-generation students.